Many people believe that native Windows programs are so deeply integrated with OS that there is no way to move them between these different OS versions. And it’s fair to say that at first this belief was reinforced by that good ol’ fashioned System File Protection (SFP) service, only to be later replaced by the Trusted Installer.
The new Windows 11 Notepad app can be very annoying, plus the news about Notepad AI integration are kinda worrying, so many people revert to Registry hacks to bring the ‘old Notepad‘ back. There are more ways than one to address this problem, and this post will focus on one of them, one that is less known…
You may not be aware, but the old Windows XP Notepad still works on Windows 11. Secondly, the same can be said about Windows 10 Notepad.
You can literally copy c:\WINDOWS\NOTEPAD.EXE from Windows XP or Windows 10 to Windows 11 and it will work like a charm. For later versions of Windows, the Notepad.exe requires language resource files to be copied as well, so you may want to copy the following files:
c:\Windows\notepad.exe
c:\Windows\en-US\notepad.exe.mui
Once you bring these old versions of Notepad to Windows 11 you can just store them in any directory you want. They are — believe or not — fully portable.
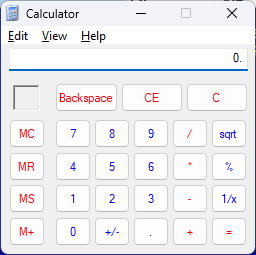
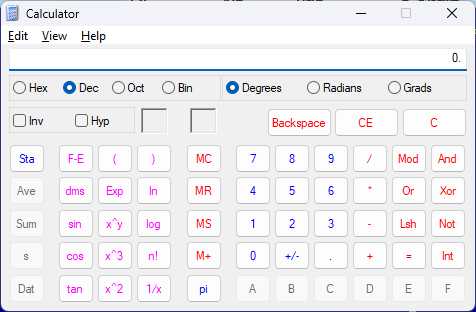
The very same can be said about Windows Calculator. While the Win10 Calculator was the first one pushing the Windows App agenda, the Windows XP Calculator can still run on Windows 11 w/o any issue:
Just copy the c:\WINDOWS\System32\calc.exe from Windows XP to Windows 11 and it will just run.
The portability of old Windows programs cannot be underestimated. With all the changes to the Windows ecosystem, with all these embedded-by-default program manifests, with all the push towards Windows Apps, ad-centric ecosystem, we still have a small window of opportunity to preserve the software that was just good at doing one thing – user-friendly programs that worked: offline, ad-, and telemetry-free.
The ServicesPipeTimeout value represents the time in milliseconds before a service process execution times out.
We can modify this value and set it to say… 5 minutes = 300,000, and then we must restart our test system.
With that change, we buy a lot of precious time that we can now utilize to attach the debugger to the service process before it times out.
The next problem is catching the moment the service process executable actually starts.
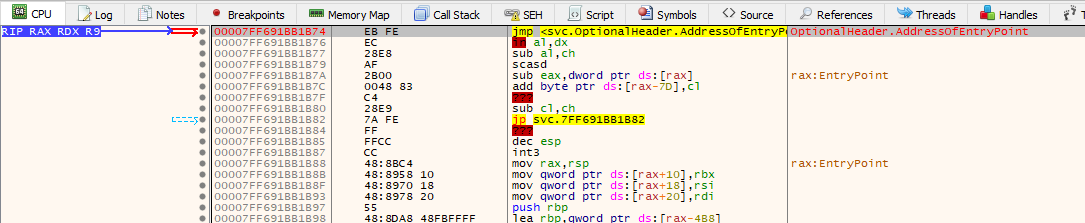
Here, the good ol’ ‘never-ending loop’ trick comes to the rescue. We take the executable that the service points to, and modify its entry point to 2 bytes: EB FE. This is an opcode for ‘jump to the beginning of the jump instruction’ aka a never-ending loop.
With that in place we are now ready to go.
The last thing to do is launching an elevated instance of your favorite user-mode debugger — this is to make sure we can attach it to a privileged service process.
Let’s go:
Modify the ServicesPipeTimeout timeout value
Restart the system
Stop the target service process if it is running (helps to change it to ‘Demand Start’ as well)
Patch the target service process binary’s entry point (or any other place where you want to break into when you attach the debugger); note: you can copy the service process’ binary to a different location and patch it, and then modify the service configuration in the Registry to point to it (HKLM\SYSTEM\CurrentControlSet\Services\<target service>\ImagePath)
Launch the debugger, elevated
Start the target service
Go to the debugger and attach it to the service process
You should now see the debugger breaking on the never-ending loop
Make a hardware execution breakpoint on the next logical instruction after the patched instruction at the entry point; this is your backup plan if the patching you do in the next point causes the program to runaway (not sure why, but it happens under xdbg)
Patch the EB FE back to original bytes
The program may now runaway, but your hardware breakpoint should stop the execution on the next instruction
Start putting the breakpoints on APIs you want to break on:
StartServiceCtrlDispatcherA
StartServiceCtrlDispatcherW
OpenSCManagerA
OpenSCManagerW
CreateServiceA
CreateServiceW
RegisterServiceCtrlHandlerA
RegisterServiceCtrlHandlerW
RegisterServiceCtrlHandlerExA
RegisterServiceCtrlHandlerExW
SetServiceStatus
etc.
Run!
Analyze!
We can test this process using the SvcName service example from Microsoft. The only modification to their source code we need to add is this:
This will ensure that our compiled Svc.exe can still work, but the installation of the service will point its binary path to Svc.exe_patched (that’s the one with the entry point we will manually patch to EB FE).
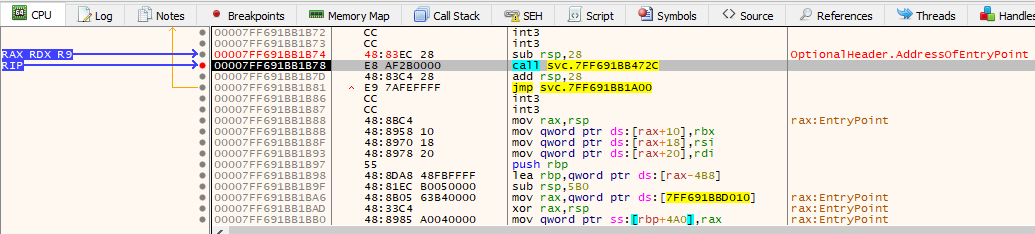
The moment we attach the debugger:
We now patch the entry point back and our hardware breakpoint stops the execution:
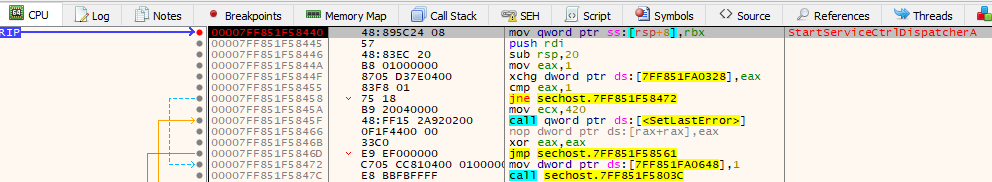
We can let the code run until the breakpoint on StartServiceCtrlDispatcherA:
We are now in control.
Bonus:
It helps to run Procmon with the filter on your service process’ events on as it may speed up analysis
Things that are weird:
Despite changing the timeout to just 5 minutes, I noticed that I could often analyze the service process for much longer than that; I don’t know the exact logic at play here
The after-patch-code-execution-runaway is an anomaly; it could be a bug in xdbg, I don’t know
Microsoft example service process code compiled at first go, w/o any troubleshooting 😉
The ServicesPipeTimeout timeout value affects all services, so if you happen to have some broken service you may see delayed system startup
There are probably other, and probably better ways to analyze windows service processes out there, but… old school is cool.