Some people write badly about you. It stings. But then you wonder… what, why, por que? Is this something I said, something I implied, something I thought of?
In the era of rapid judgment AD 2020 I found myself a subject to Twitter blocks and criticism on more than one occasion. My lesson learned bit is that dudes (so far dudes only) blocked me on Twitter because they don’t agree with my opinion/take/whatever. I always believed that if we were about to drive someone to obscurity by social media banning then it would require us to follow a meticulously explored path of questioning and probing, you know, to understand their point of view, but hell no…. it’s far easier to just block & forget.
Cuz Twitter.
As such I reply to my blockers: come at me with arguments and not blocks. I am not always right, but will listen and will change my mind, if you make me so…
I don’t like Windows 10, but it likes… the progress…
So… now that win7 is ded, and winxp doesn’t work that well for malware analysis (and it’s 32-bit only), I finally (a few months back really) put myself together to build my perfect test guest 64-bit Windows 10 OS… and while doing so I came across a lot of quirks, took some screenshots, and I thought I will jot down some notes here in case you face similar issues…
Note, I am a big fan of VMWare, so the info below is primarily focused on VMWare Workstation… VirtualBox experience should not be too far off though… I hope….
Here are the steps I took to make my Windows 10 Guest OS perfect (to be clear, I followed many of these steps on my host Windows 10 as well):
Install to SSD
I bought my first SSD circa 2011 and never looked back; this an incredible performance booster and you need it for your frequently used VM guests!!!
Assume your SSD will go kaput on you at any time around 3-5 years down the line, so make regular backups
Install the Windows 10 OS; whether you go from a clean ISO, or upgrade your old Win7/Win8 it doesn’t matter
Go through the wizard…
Choose your OS version and continue until you install the whole thing
Note: do not use Microsoft accounts if asked, only the local one!!!
Decline all the privacy/spying Options:
Go on…
After 1-2 restarts you should have a clean OS installed
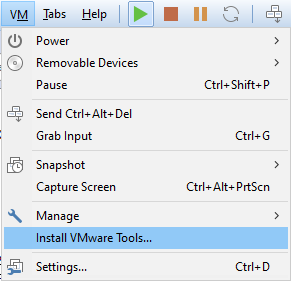
It’s time to install VM Tools:
You may need to run the VMTools setup64.exe manually from a mounted DVD:
Restart
At this stage you have the OS installed and VM Tools are running – SAVE THE VM SNAPSHOT NOW. If anything goes wrong, you can revert to it.
The VM tools allows you to change screen resolution and copy & paste between the host and the guest system, as well as access the network shares.
Hooray!
But it’s just the beginning…
Download and run O&O ShutUp10. Choose all options aka ‘Apply all settings’. Yup, make it all green:
You will need to restart the system after applying the changes
Now…
OS is installed, the basic nuisance is gone, but it’s not over yet.
Run psexec -s -i cmd.exe from your elevated cmd.exe (admin)
Now you have a terminal under SYSTEM account
Launch Regedit.exe
Go to Computer\HKEY_LOCAL_MACHINE\SYSTEM\CurrentControlSet\Services
Yeaah…
Time to kill annoying services:
You have two options: be a good boy, or a bad boy; choose the latter….
aka….
Walk through all of them; I know it’s painful, but…
If you don’t like the particular service, just mod its ‘Start’ entry to become ‘4’ which is an equivalent of ‘Disabled’
I know for some options you can run gpedit.msc and select ‘disable service’ options under admin templates, but well… these will in the end run services. Since you just want to kill the nuisance, kill it at source i.e. this is right under Services key… Be brutal… Windows 10 is a telemetry and nuisance virus and you need to make it work like kinda enhanced Windows 7.
In particular, disable Windows Update, Windows Defender, MS Store, Security Health services and Search indexing
Be aware that disabling all this you will lose updating capability –> snapshots are your friends !!!
Time to customize your UI
I personally prefer good ALT-TAB with icons, so I add