This is just a simple proof of concept that can be extended to build a full-blown Delphi API Monitor.
Delphi lives in its own API ecosystem. Reversing Delphi applications requires us to use a dedicated tool/decompiler (e.g. IDR), flirt signatures, and most of this work relies on DCU32INT decompiler. When I built my sandbox and wanted to add Delphi support I created some mini-signatures for some of the more crucial Delphi APIs and anytime Delphi app would be analyzed, I’d look for code patterns, patch them with my API hook, and then observe the results (I described it here).
With the invention of new reversing tools we have an opportunity to re-visit this topic to rapidly produce a prototype of a Delphi API monitor that will be fast, robust and will cover most angles.
Before we begin, couple of points first:
- Multiple versions of the same API exist:
- it’s just a different binary encoding of the same functions that made it to Delphi DCUs f.ex. LStrFromString:
- 870C245131C98A0A42E9xxxxxxxxC3
- FF3424894C240431C98A0A42E9xxxxxxxxC3
- you may also come across differences in API declarations e.g.:
- LStrLen (const S: AnsiString)
- LStrLen (const S: string)
- it’s just a different binary encoding of the same functions that made it to Delphi DCUs f.ex. LStrFromString:
- Delphi APIs use a different calling convention, so need to take it into account while writing Frida handlers — eax, edx registers being the registers that Delphi uses to pass 2 first arguments
- Strings used by Delphi are encoded differently than in C, with the most typical being a length of the string encoded in first byte followed by the actual string (there are others)
- Frida hooking engine accepts both Win32 API module/API names and addresses; the addresses need to be provided as RVA offsets within a monitored module f.ex. -a foo.exe!address
- For each foo.exe!address, you need to create a respective handler called sub_<address>.js e.g. sub_34AF.js.
With that, we just need to find an application for testing, and write our first handler.
The old Resource Hacker is written in Delphi. Using IDA we can quickly identify one of its comparison functions PStrCmp at address 0x004029E0 (RVA=29E0):

The example handler showing the calls to this API with parameters can look like this:
{
   onEnter(log, args, state) {
     eax_len = this.context.eax.readS8();
     edx_len = this.context.edx.readS8();
     eax_str = this.context.eax.add(1).readUtf8String(eax_len);
     edx_str = this.context.edx.add(1).readUtf8String(edx_len);
 console.log(this.context.eip + ":" + eax_str+" "+edx_str);
 },
 onLeave(log, retval, state) {
   }
 }
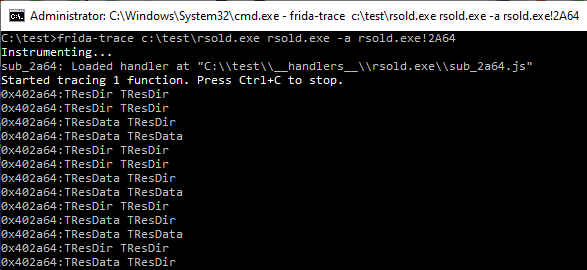
Now if we launch rsold.exe under frida-trace:
frida-trace c:\test\rsold.exe c:\windows\notepad.exe -a rsold.exe!2A64
which will tell frida-tools to load old Resource Hacker (rsold.exe) and make it open resources of c:\windows\notepad.exe, and add API hook for PStrCmp (RVA=29E0 –> handlers\rsold.exe\sub_2a64.js), we get result like this:
Now that we know what we can do with it, there are at least 2 different avenues we can follow:
- Write an idapython script that will export handlers for a given binary and for our APIs of choice
- Use DCU32INT and export code for functions of interest from as many Delphi/CodeGear/Embarcadero versions as possible, then convert them into regular expressions (or leverage yara) and build signatures; find these signatures inside target Delphi PE files and convert file offsets of matched hits to RVA offsets, and finally export handlers for all functions of interest (no need for IDA in this case)
What are interesting APIs to handle?
Could start with strings — these are often great to understand the inner workings of programs:
- LStrCat
- LStrFromPWChar
- LStrFromPWCharLen
- LStrCatN
- LStrCat3
- LStrSetLength
- LStrFromPChar
- LStrAsg
- LStrCopy
- LStrCmp
- LStrLAsg
- LStrInsert
- LStrDelete
- LStrArrayClr
- LStrToPChar
- LStrFromPCharLen
- LStrClr
- LStrFromWArray
- LStrFromWStr
- LStrFromArray
- LStrFromChar
- LStrFromWChar
- LStrFromUStr
- LStrAddRef
- LStrToString
- LStrFromString
- LStrEqual
- LStrPos
- LStrLen
- LStrFromLenStr
- LStrOfChar
File operations are of interest as well f.ex.:
- ChangeFileExt
- CreateDir
- DateTimeToFileDate
- DeleteFile
- DiskFree
- DiskSize
- ExpandFileName
- ExpandUNCFileName
- ExtractFileDir
- ExtractFileDrive
- ExtractFileExt
- ExtractFileName
- ExtractFilePath
- FileAge
- FileClose
- FileCreate
- FileDateToDateTime
- FileExists
- FileGetAttr
- FileGetDate
- FileOpen
- FileRead
- FileSearch
- FileSeek
- FileSetAttr
- FileSetDate
- FileWrite
- FindClose
- FindFirst
- FindNext
- GetCurrentDir
- RemoveDir
- RenameFile
- SetCurrentDir


