How to debug Windows service processes in the most old-school possible way…

Debugging Service Processes on Windows is a bit tricky – the old IFO / Debugger trick doesn’t work anymore, because services run in their own session.

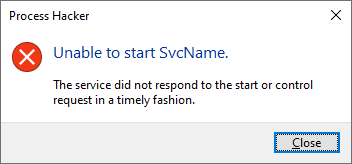
Also, when you attempt to debug a service process by attaching your debugger to it, you will often come across this error message:

ERROR_SERVICE_REQUEST_TIMEOUT

1053 (0x41D)

The service did not respond to the start or control request in a timely fashion.

or its GUI equivalent:

Luckily, we can adjust the value of this timeout by modifying the following Registry DWORD value:

HKEY_LOCAL_MACHINE\SYSTEM\CurrentControlSet\Control\ServicesPipeTimeout

The ServicesPipeTimeout value represents the time in milliseconds before a service process execution times out.

We can modify this value and set it to say… 5 minutes = 300,000, and then we must restart our test system.

With that change, we buy a lot of precious time that we can now utilize to attach the debugger to the service process before it times out.

The next problem is catching the moment the service process executable actually starts.

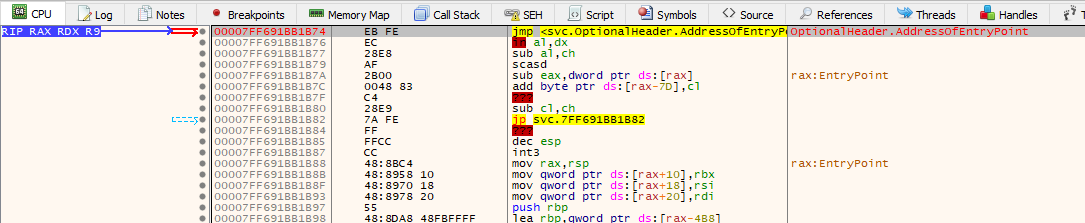
Here, the good ol’ ‘never-ending loop’ trick comes to the rescue. We take the executable that the service points to, and modify its entry point to 2 bytes: EB FE. This is an opcode for ‘jump to the beginning of the jump instruction’ aka a never-ending loop.

With that in place we are now ready to go.

The last thing to do is launching an elevated instance of your favorite user-mode debugger — this is to make sure we can attach it to a privileged service process.

Let’s go:

  • Modify the ServicesPipeTimeout timeout value
  • Restart the system
  • Stop the target service process if it is running (helps to change it to ‘Demand Start’ as well)
  • Patch the target service process binary’s entry point (or any other place where you want to break into when you attach the debugger); note: you can copy the service process’ binary to a different location and patch it, and then modify the service configuration in the Registry to point to it (HKLM\SYSTEM\CurrentControlSet\Services\<target service>\ImagePath)
  • Launch the debugger, elevated
  • Start the target service
  • Go to the debugger and attach it to the service process
  • You should now see the debugger breaking on the never-ending loop
  • Make a hardware execution breakpoint on the next logical instruction after the patched instruction at the entry point; this is your backup plan if the patching you do in the next point causes the program to runaway (not sure why, but it happens under xdbg)
  • Patch the EB FE back to original bytes
  • The program may now runaway, but your hardware breakpoint should stop the execution on the next instruction
  • Start putting the breakpoints on APIs you want to break on:
    • StartServiceCtrlDispatcherA
    • StartServiceCtrlDispatcherW
    • OpenSCManagerA
    • OpenSCManagerW
    • CreateServiceA
    • CreateServiceW
    • RegisterServiceCtrlHandlerA
    • RegisterServiceCtrlHandlerW
    • RegisterServiceCtrlHandlerExA
    • RegisterServiceCtrlHandlerExW
    • SetServiceStatus
    • etc.
  • Run!
  • Analyze!

We can test this process using the SvcName service example from Microsoft. The only modification to their source code we need to add is this:

StringCbPrintf(szPath, MAX_PATH, TEXT("\"%s_patched\""), szUnquotedPath);

inside the Svc.cpp file.

This will ensure that our compiled Svc.exe can still work, but the installation of the service will point its binary path to Svc.exe_patched (that’s the one with the entry point we will manually patch to EB FE).

The moment we attach the debugger:

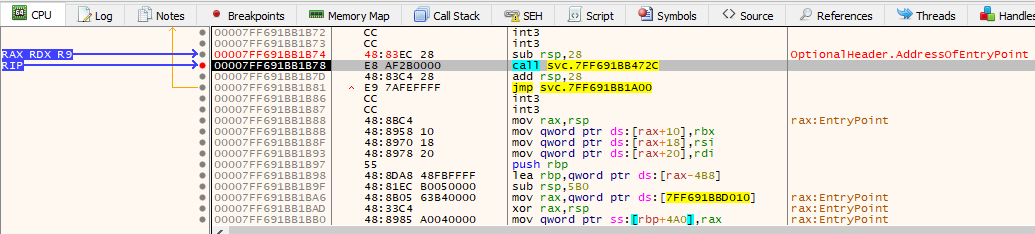
We now patch the entry point back and our hardware breakpoint stops the execution:

We can let the code run until the breakpoint on StartServiceCtrlDispatcherA:

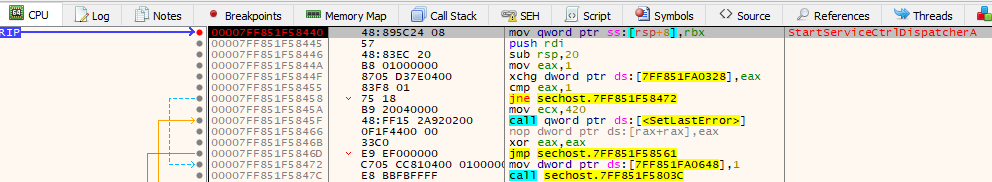
We are now in control.

Bonus:

  • It helps to run Procmon with the filter on your service process’ events on as it may speed up analysis

Things that are weird:

  • Despite changing the timeout to just 5 minutes, I noticed that I could often analyze the service process for much longer than that; I don’t know the exact logic at play here
  • The after-patch-code-execution-runaway is an anomaly; it could be a bug in xdbg, I don’t know
  • Microsoft example service process code compiled at first go, w/o any troubleshooting 😉
  • The ServicesPipeTimeout timeout value affects all services, so if you happen to have some broken service you may see delayed system startup

There are probably other, and probably better ways to analyze windows service processes out there, but… old school is cool.

Going reverse on reversing tools…

One of the oldest and most popular reversing tools is IDA Pro (usually bundled with its multiple decompilers&plug-ins). Over the years, the creators of this tool introduced a lot of substantial changes to this software, and in parallel, a lot of changes have been introduced to the programming frameworks newer IDA Pro versions rely on (namely, Python).

I bet some old OG IDA Pro users and reversers still remember the time they spent writing their first IDC scripts… and I bet some younger OGs reminisce similar memorable moments and feels about their early idapython scripts based on Python 2.x. Unfortunately, with many changes introduced to Python and IdaPython over the years we now live in a world where multiple parallel IDA Pro universes exist. The world in which many very useful plug-ins, scripts that just… used to ‘work’… today fail to work and they do so miserably…

Over the last 10 years or so, I’ve spent a substantial amount of time trying to port many of these older IDA Python-based plug-ins/scripts to that ‘latest, newest version’ of IDAPython du jour. It actually takes a lot of time, and it’s mainly because I am not the best person to be tasked with this upgrading task, plus the frequent changes on so many fronts are really hard to keep up with, so… in many of these past instances where I actually tried, I often did end up just throwing a towel in the end… It’s just not worth it, and I must say here that I have arrived at this sad conclusion on more than just one occasion…

BUT I STILL LOVE SOME OF THESE OLD PLUG-INS!

Then one day it hit me.

The answer to all our IDA Plugin code incompatibility problems is… keeping multiple IDA Pro versions installed at the same time! And then, using an appropriate IDA Pro version for which these plug-ins or scripts were created for – run them, collect their output and… incorporate this output into our ‘working’ IDA database, typically created by ‘the latest and greatest’ version of IDA.

It may sound stupid, but it actually does work quite well!

Today I temporarily install older IDA Pro versions on my test malware box on regular basis — they are often a few years old, totally obsolete, but they offer one important feature to me – they still run that specific old plug-in/script code for me!

How does it work in practice?

In generic terms, you just install the old version of IDA, open the sample you are working on in that old IDA version, and then you run the actual code (plug-in or script) that this particular IDA Pro version supports. After that, you export the IDC script from the database (File -> Produce File -> Dump database to IDC file). Then you edit that exported IDC script to only call out to the functions or snippets of code that introduce changes you want… Then you import it into your ‘current’/’working’ IDA database….

And yeah, at first sight, this exported IDC script may look messy, but it’s easy to navigate, plus we can quickly notice that we can comment out all the unnecessary function calls inside its main function, and then we just focus on the functions we really want to execute – some of them adding structures, enums, naming locations, adding comments, etc.

The main function of a typical IDA-exported IDC script looks like this:

static main(void)
{
        // set 'loading idc file' mode
        set_inf_attr(INF_GENFLAGS, INFFL_LOADIDC|get_inf_attr(INF_GENFLAGS));
        GenInfo();            // various settings
        Segments();           // segmentation
        Enums();              // enumerations
        Structures();         // structure types
        ApplyStrucTInfos();   // structure type infos
        Patches();            // manual patches
        SegRegs();            // segment register values
        Bytes();              // individual bytes (code,data)
        Functions();          // function definitions
        // clear 'loading idc file' mode
        set_inf_attr(INF_GENFLAGS, ~INFFL_LOADIDC&get_inf_attr(INF_GENFLAGS));
}

Many of these high-level functions include call outs to similarly named, second-level functions – it’s actually really easy to follow and edit them. For example, if the main function calls out a Bytes function it’s most likely we will see it making call outs to multiple functions prefixed with the word Bytes:

static Bytes(void) {
	Bytes_0();
	Bytes_1();
	Bytes_2();
	Bytes_3();
	Bytes_4();
        end_type_updating(UTP_STRUCT);
}

You can quickly eyeball all of these functions’ bodies and decide which code/function call to comment out…

It usually takes less than 5-10 minutes to do so, and as a result you cherry-pick the exact metadata you want to import into your ‘working’ database (usually the one created with the latest available version of IDA Pro).

In the last few years I have used this approach many times, often during time-sensitive malware analysis engagements, and am happy to report that it does work quite well.

Aka: don’t fight the system, use it.

The other avenue to pursue here is to introduce subtle, cosmetic modifications to the old plug-ins’ code that you can modify to generate a code that is ‘compatible’ with the most up-to-date version of Ida and its IdaPython modules.

We can do it, because the output of many reversing IDA Python scrips is pretty predictable:

  • new names
  • new labels
  • new comments
  • list of offsets for code/data patching and actual patches
  • extracted / decrypted configs, strings
  • etc.

It’s actually very easy to add small code snippets to the old plug-ins that will generate a precise list of instructions encoded using the latest version of IdaPython, then save them into a temporary IdaPython script file that is compatible with the latest and greatest version of IDA Python. Such dynamically generated code can be then executed within a context of the database opened with the latest version of Ida Pro. Easy Peasy.

The bottom line is this:

  • make multiple versions of your reverse engineering tools work for you