Being a tool while using a tool

This case is kinda DFIR-fascinating.

There is an unwritten rule in the DFIR world that says – always check the results provided by one tool, with another tool, or manually…

Well… it all sounds nice in theory, until we come across a case that will change it all.

So…

If you use many different tools, and on regular basis, be warned that this case will destroy your faith in them…

Ready?

Let’s go!

I have been using Total Commander for over 2 decades. I absolutely love this tool, and can’t imagine working with gazillion of files and samples that I play with on regular basis, without using it.

But recently, I got fooled by it.

When you download the Signal desktop client installer for Windows (v7.39), you can browse its contents with Total Commander+its (various) archive plugins to see the following output:

I was specifically interested in the Signal.exe binary so I used TC to copy Signal.exe to my temporary work folder.

To my surprise, the sigcheck reported that this binary was compiled for… ARM processors!

Verified:       Signed
Signing date:   01:00 2025-01-23
Publisher:      Signal Messenger, LLC
Company:        Signal Messenger, LLC
Description:    Signal
Product:        Signal
Prod version:   7.39.0.0
File version:   7.39.0
MachineType:    64-bit ARM

Huh?

I was puzzled.

I literally downloaded what I believed to be an installer of Signal that was meant for Intel-based Windows, but now I am seeing the ARM binary inside it!

<Anxiety level intensifies>

I then tried the very same approach with the installer of the older version of Signal (7.38), but the result was the same….

What’s going on here? I wondered…

I must make a note here that the Signal setup program is using the Nullsoft installer to deliver the software to users. And in the reverse engineering world, once you recognize the installer type, the natural step in analysis is to decompile the script used by the installer.

Using the older version of 7z (7z_1505) that extracts the [NSIS].nsi script file I got the following output listing all the embedded files inside the most recent Signal installer:

$PLUGINSDIR\app-64.7z
$PLUGINSDIR\app-arm64.7z
$PLUGINSDIR\nsExec.dll
$PLUGINSDIR\nsis7z.dll
$PLUGINSDIR\SpiderBanner.dll
$PLUGINSDIR\StdUtils.dll
$PLUGINSDIR\System.dll
$PLUGINSDIR\WinShell.dll
$R0\Uninstall Signal.exe
$PLUGINSDIR\installerHeaderico.ico
[NSIS].nsi

Huh…

As you can see, there are two embedded 7z files listed above:

  • $PLUGINSDIR\app-64.7z
  • $PLUGINSDIR\app-arm64.7z

The first one is Intel-based, and the second one is ARM-based.

The [NSIS].nsi script references them here (using the respective 7z file depending on the architecture):

label_796:
  StrCmp $_40_ ARM64 0 label_799
  SetOverwrite on
  AllowSkipFiles on
  File $PLUGINSDIR\app-arm64.7z
  Goto label_802
label_799:
  StrCmp $_40_ 64 0 label_802
  File $PLUGINSDIR\app-64.7z
  Goto label_802

Kinda surprisingly, we can actually locate these 2 7z files inside the main installer file at the following offsets:

  • 0x0003C57B – app-arm64.7z
  • 0x087904C4 – app-64.7z

and after carving/extraction, browsing them with Total Commander we can reveal their content as shown below:

ARM (app-arm64.7z):

INTEL (app-64.7z):

Do you see where it is going?

With files/installers using many embedded files, the Total Commander’s (+its plugins’) visibility seems to be limited only to the first embedded archive, in this case it is the app-arm64.7z file! (in fact, it’s a bit more complicated in case TC or its plugins can parse PE file/their sections of the sample, adding an additional layer in a game of nested dolls).

When I look at that original Signal installer again now I can see the Total Commander (+its plug-ins) only see the first embedded archive. As a result, I see the Intel-targeting setup file embedding the ARM-targeting file shown in TC. The proper handling would include full file analysis of the installer and recognition of all embedded archives as virtual subfolders… at least.

The bottom line is this:

  • Let’s admit it, file formats are complicated, especially if they are mixed/overlapping
  • Trust, but verify — use multiple tools to extract/parse installer scripts, analyze/compare their outputs
  • Don’t trust GUI-only programs
  • Question what you see (in my case: the Intel-CPU targeting installer including ARM binaries as seen by TC in the installer’s body looked odd)
  • Analyze as many properly formatted file types as possible on a file format level to spot anomalies and inconsistencies in the future
  • Use carving and static analysis tools on samples: extracted sections, embedded media files, executables, configuration files, URLs, IPs. github repository addresses, PDB paths, etc. – this can add a lot of intelligence value long term
How to debug Windows service processes in the most old-school possible way…

Debugging Service Processes on Windows is a bit tricky – the old IFO / Debugger trick doesn’t work anymore, because services run in their own session.

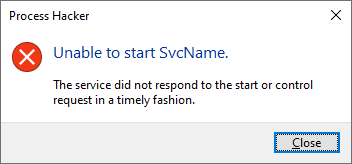
Also, when you attempt to debug a service process by attaching your debugger to it, you will often come across this error message:

ERROR_SERVICE_REQUEST_TIMEOUT

1053 (0x41D)

The service did not respond to the start or control request in a timely fashion.

or its GUI equivalent:

Luckily, we can adjust the value of this timeout by modifying the following Registry DWORD value:

HKEY_LOCAL_MACHINE\SYSTEM\CurrentControlSet\Control\ServicesPipeTimeout

The ServicesPipeTimeout value represents the time in milliseconds before a service process execution times out.

We can modify this value and set it to say… 5 minutes = 300,000, and then we must restart our test system.

With that change, we buy a lot of precious time that we can now utilize to attach the debugger to the service process before it times out.

The next problem is catching the moment the service process executable actually starts.

Here, the good ol’ ‘never-ending loop’ trick comes to the rescue. We take the executable that the service points to, and modify its entry point to 2 bytes: EB FE. This is an opcode for ‘jump to the beginning of the jump instruction’ aka a never-ending loop.

With that in place we are now ready to go.

The last thing to do is launching an elevated instance of your favorite user-mode debugger — this is to make sure we can attach it to a privileged service process.

Let’s go:

  • Modify the ServicesPipeTimeout timeout value
  • Restart the system
  • Stop the target service process if it is running (helps to change it to ‘Demand Start’ as well)
  • Patch the target service process binary’s entry point (or any other place where you want to break into when you attach the debugger); note: you can copy the service process’ binary to a different location and patch it, and then modify the service configuration in the Registry to point to it (HKLM\SYSTEM\CurrentControlSet\Services\<target service>\ImagePath)
  • Launch the debugger, elevated
  • Start the target service
  • Go to the debugger and attach it to the service process
  • You should now see the debugger breaking on the never-ending loop
  • Make a hardware execution breakpoint on the next logical instruction after the patched instruction at the entry point; this is your backup plan if the patching you do in the next point causes the program to runaway (not sure why, but it happens under xdbg)
  • Patch the EB FE back to original bytes
  • The program may now runaway, but your hardware breakpoint should stop the execution on the next instruction
  • Start putting the breakpoints on APIs you want to break on:
    • StartServiceCtrlDispatcherA
    • StartServiceCtrlDispatcherW
    • OpenSCManagerA
    • OpenSCManagerW
    • CreateServiceA
    • CreateServiceW
    • RegisterServiceCtrlHandlerA
    • RegisterServiceCtrlHandlerW
    • RegisterServiceCtrlHandlerExA
    • RegisterServiceCtrlHandlerExW
    • SetServiceStatus
    • etc.
  • Run!
  • Analyze!

We can test this process using the SvcName service example from Microsoft. The only modification to their source code we need to add is this:

StringCbPrintf(szPath, MAX_PATH, TEXT("\"%s_patched\""), szUnquotedPath);

inside the Svc.cpp file.

This will ensure that our compiled Svc.exe can still work, but the installation of the service will point its binary path to Svc.exe_patched (that’s the one with the entry point we will manually patch to EB FE).

The moment we attach the debugger:

We now patch the entry point back and our hardware breakpoint stops the execution:

We can let the code run until the breakpoint on StartServiceCtrlDispatcherA:

We are now in control.

Bonus:

  • It helps to run Procmon with the filter on your service process’ events on as it may speed up analysis

Things that are weird:

  • Despite changing the timeout to just 5 minutes, I noticed that I could often analyze the service process for much longer than that; I don’t know the exact logic at play here
  • The after-patch-code-execution-runaway is an anomaly; it could be a bug in xdbg, I don’t know
  • Microsoft example service process code compiled at first go, w/o any troubleshooting 😉
  • The ServicesPipeTimeout timeout value affects all services, so if you happen to have some broken service you may see delayed system startup

There are probably other, and probably better ways to analyze windows service processes out there, but… old school is cool.