In my yesterday’s post I described a simple clustering algorithm that could be used to group files that contain references to each other. Today I am posting the source code of the program that generated the data in my last post, together with a demo that shows how powerful such clustering could be if combined with proper visualization techniques.
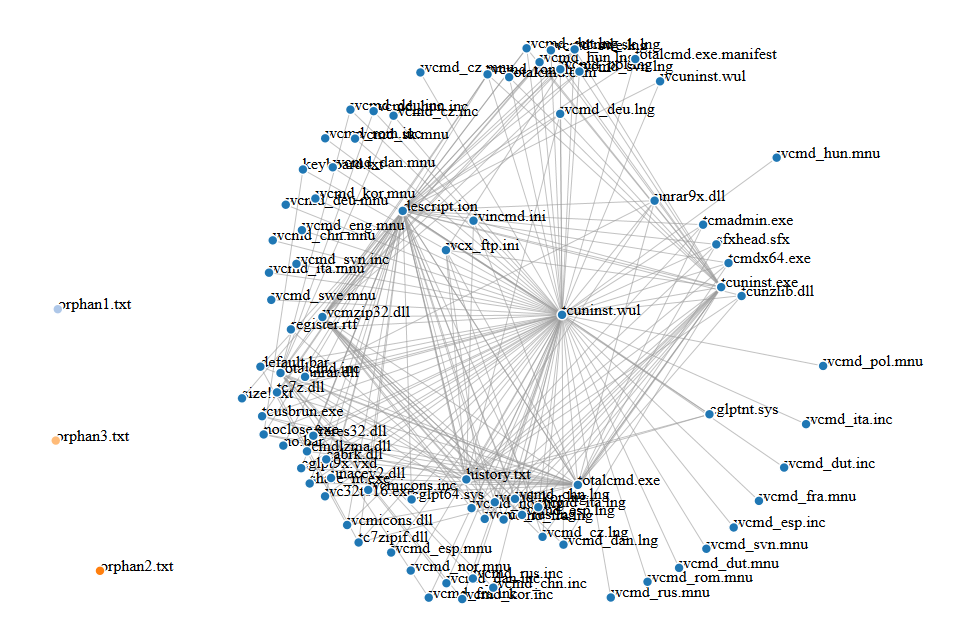
In the example I have shown, I used a relatively small folder where Total Commander was installed. The resulting cluster looks like this:
 You can play with it interactively here.
Imagine that someone adds files to the Total Commander folder. Since they are not referenced by any other file in this folder, they will create separate clusters. After adding 3 such files:
- orphan1.txt
- orphan2.txt
- orphan3.txt
we get the following clusters:
 You can play with it interactively here (you need to drag the orphans away to get the same result as shown on the screenshot).
Finally, we can imagine that a hacker of malware creates a couple of files that are perhaps referencing each other. An example could be:
- config.bin
- keystrokes.txt
- malware.exe – referencing keystrokes.txt and config.bin
If we now cluster this directory, we will get something like this:
 The ‘malware’ files clearly stand out.
You can play with it interactively here (again, you need to drag the nodes away to get the same result as shown on the screenshot).
For more examples see part 3.
I believe there is a lot of opportunities in leveraging clustering to reduce the amount of data we need to analyze and to improve user experience by introducing new ways to look at data. There are a lot of visualization techniques that are not used in forensic software today and it is a pity. Clustering adds an extra dimension on top of a timeline and structure imposed by the organization of a file system – we can only hope that forensic software of the future will take this into account.
For inspiration and really amazing examples of visualization go to https://github.com/mbostock/d3/wiki/Gallery. I used the very same script to create the interactive demos referenced by this post.
The source code of the filighter script that generates these clusters is here.
Wouldn’t this sort of thing run the risk of false positives, sending analysts down the wrong investigative path?
What happens if a program creates text-based files in it’s own directory, but doesn’t contain the names of those files, instead using an algorithm to create them?
Or, what happens if the program does reference the files, but creates them in another directory (C:\Temp, C:\Windows\Temp, etc) all together?
Another situation to deal with would be DLL Side Loading, in which a “legit” non-malicious .exe file references a DLL that is, in this case, the malware.
I can see where this would be useful, albeit in a somewhat narrow range of use cases. What I’ve done since reading your post this morning is try to imagine how I’d be able to use this in the work that I do, and in what I see others doing. I’m not saying that this is a bad idea…actually, I’m saying the opposite, I think it’s a good idea…but I’m having trouble seeing how it’s value in the instances where I might use it.
Thanks for sharing this.
Thanks for the comment. It is not a replacement for traditional approach – I see it more as an additional filtering solution that could help to temporarily hide clusters of files from the view (if they relationship can be established with a given threshold). That could help investigators to find the smoking gun and speed up analysis. The post is also an invitation to explore other forms of visualizations that forensic software does not use today.