When you google for “PSScripts.ini” you will find only around 200 results or so. This is a bit surprising, given the fact Microsoft documents this Powershell-based persistence mechanism on their web page for quite some time and even describes in detail the syntax of the PSScripts.ini file. Let alone the fact the mechanism – a close cousin of scripts.ini which I described in the past – is available on Windows 7 and Windows 2008 Server R2 for many years…
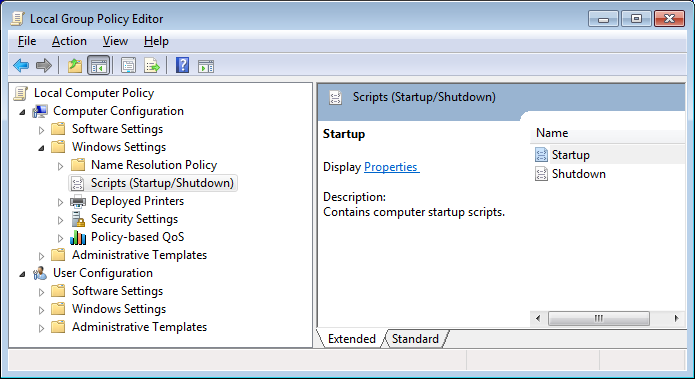
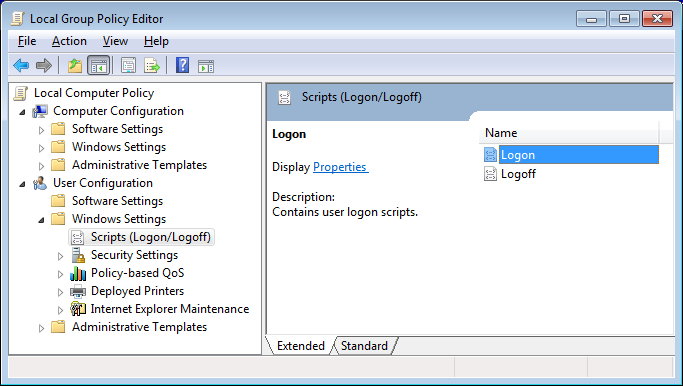
To access the configuration of the PSScripts.ini we can launch gpedit.msc and find the familiar settings:
 Clicking ‘Startup’ or ‘Shutdown’ properties will open a new dialog box where we can see two tabs: one for scripts.ini (Windows Startup Scripts) and the second one for PSScripts.ini (PowerShell Startup Scripts):
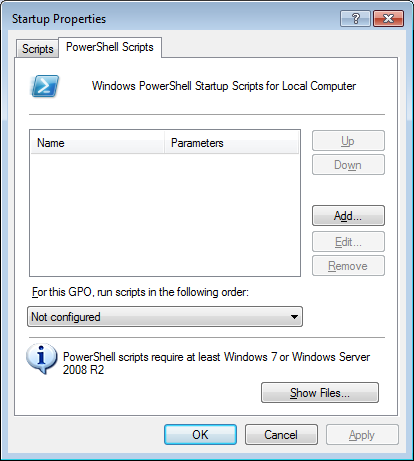 The information provided at the bottom of the dialog confirms that ‘PowerShell scripts require at least Windows 7 or Windows Server 2008 R2’ – not a big problem nowadays.
If we now add our own test script called malware.ps1:
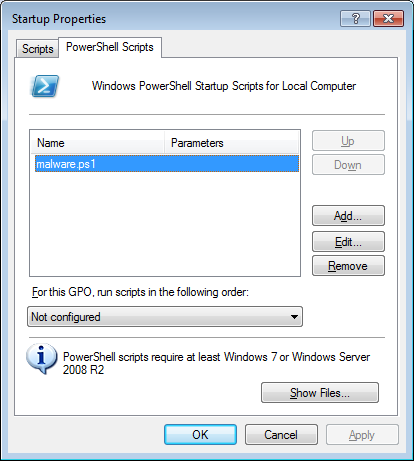
we will notice that a number of artifacts have been added to the system:
- c:\Windows\System32\GroupPolicy\Machine\Scripts\psscripts.ini
[Startup]
0CmdLine=malware.ps1
0Parameters=
- c:\Windows\System32\GroupPolicy\Machine\Scripts\Startup\malware.ps1 (this is the test script; it just waits for a key to be pressed)
$null = $Host.UI.RawUI.ReadKey('NoEcho,IncludeKeyDown');
- HKLM\SOFTWARE\Microsoft\Windows\CurrentVersion\
Group Policy\State\Machine\Scripts\Startup\0\0
"Script"="malware.ps1"
"Parameters"=""
"ExecTime"=hex(b):00,00,00,00,00,00,00,00,00,00,00,00,00,00,00,00
- HKLM\SOFTWARE\Microsoft\Windows\CurrentVersion\
Group Policy\Scripts\Startup\0\0
"Script"="malware.ps1"
"Parameters"=""
"IsPowershell"=dword:00000001
"ExecTime"=hex(b):00,00,00,00,00,00,00,00,00,00,00,00,00,00,00,00
- HKLM\SOFTWARE\Microsoft\Windows\CurrentVersion\Group Policy\
History\{42B5FAAE-6536-11d2-AE5A-0000F87571E3}\0
"Options"=dword:00000000
"Version"=dword:00010001
"DSPath"="LocalGPO"
"FileSysPath"="C:\\Windows\\System32\\GroupPolicy\\Machine"
"DisplayName"="Local Group Policy"
"Extensions"="[{42B5FAAE-6536-11D2-AE5A-0000F87571E3}{40B6664F-4972-11D1-A7CA-0000F87571E3}]"
"Link"="Local"
"GPOName"="Local Group Policy"
"GPOLink"=dword:00000001
"lParam"=dword:00000000
The ’42B5FAAE-6536-11d2-AE5A-0000F87571E3′ GUID is associated with a component named ‘ProcessScriptsGroupPolicy’.
After restarting the system we can immediately see that the script was launched:
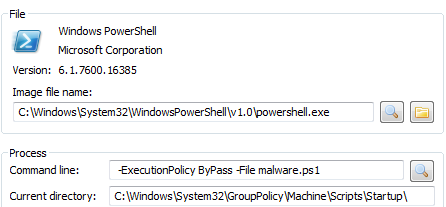
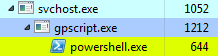 We can confirm it’s indeed our script by inspecting the properties of powershell.exe process pointing to our test script (since it waits for the key to be pressed it just runs idle in a background):
 The good news is that Autoruns already detects these entries:
![]() We are now half way through, so bear with me :).
We are now half way through, so bear with me :).
There can be 2 PSScripts.ini on the system – the second configured for (all) the users. If you go back to to the gpedit.msc dialog box, you can browse the user configuration as well:
 The 2 events that Powershell scripts can be associated with are ‘Logon’ and ‘Logoff’. When we now add a similar test script we will achieve persistence that will be attached to one or both of these events.
I don’t describe it here, but it’s possible to decide in what sequence the script.ini and PSscript.ini should be processed.
Back to our User-specific scripts. The artifacts can be found in the Registry under the following keys:
- HKCU\Software\Microsoft\Windows\CurrentVersion\Group Policy\Scripts
- HKLM\SOFTWARE\Microsoft\Windows\CurrentVersion\Group Policy\
State\[SID]\Scripts
and the files are in a pretty much same place as the system-specific scripts:
- c:\Windows\System32\GroupPolicy
The file system tree where the scripts are located looks like this:
├───Machine
│   └───Scripts
│       ├───Shutdown
│       └───Startup
└───User
    └───Scripts
        ├───Logoff
        └───Logon
Last, but not least – the latest Autoruns doesn’t seem to be detecting the user-specific scripts.