logman & API Trace & lame anti-tracing trick :)

As I explained in my older post I was playing around with an obscure logman functionality that could be used for API Tracing.

Using these two commands:

logman create api foo -f bincirc 
-exe c:\windows\notepad.exe
-o c:\test\notepad.etl
logman start foo

one can start tracing API calls inside the Notepad. The resulting .etl file can be then parsed with ETL Parser – a really cool tool from @HECFBlog‘s @nicoleibrahim.

When I came across it I thought API Tracing supported natively by OS is a cool and promising feature. So I thought at first… then I started digging deeper. In particular, I was curious how the functionality was implemented and why it didn’t work on Windows 10. After some poking around I think I found the answers.

The functionality is implemented via Application patching using these SDB databases:

  • c:\WINDOWS\AppPatch\sysmain.sdb – 32-bit Win7
  • c:\WINDOWS\AppPatch\AppPatch64\sysmain.sdb – 64-bit Win 7, at least in theory

When used (the actual mechanism of loading the patch is not known to me at the moment), the system loads the following files into a traced application’s process:

  • c:\WINDOWS\AppPatch\apihex86.dll (win7 32)
  • c:\WINDOWS\AppPatch\AppPatch64\apihex64.dll (win7 64), at least in theory

Example from Windows 7 32-bit:

You will find a couple of other libs loaded inside the process as well.

  • amxread.dll – API Tracing Manifest Read Library – possibly mapping APIs to their description (?) – have not spent too much time on it
  • apilogen.dll – API Tracing Log Engine – it is responsible for the actual trace writes; anyone who has too much time on their hand could try to reverse it and improve the API Trace parser, but it’s probably not worth it

With Windows 64-bit I couldn’t make it work despite ensuring all the commands were run from 64-bit processes; so… the ‘at least in theory’ bits are referring to this problem. In any case, it’s probably an obscure mechanism that is no longer supported; this leads us to…

Question #2

Windows 10 doesn’t seem to support it. I couldn’t make it work either + I don’t see the aforementioned DLLs in any of the Windows subfolders. Well, there you go. A cool functionality that never stood a chance…  oh well…

Last, but not least – here’s your promised anti-* trick:

  • check if your program is loading any of these listed DLLs and abort if any is found. I have added these to the list of naughty libraries even I know the usefulness is close to nil. Still, what’s documented is better understood.

And one more bit:

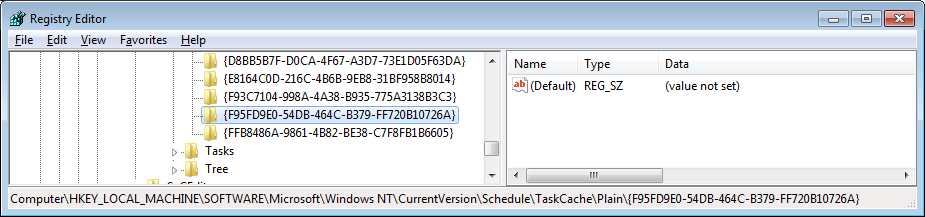
When the command to create API trace is called, the system adds this Reghitry key:

  • HKLM\SOFTWARE\Microsoft\Windows NT\
    CurrentVersion\Schedule\TaskCache\Tree\
    Microsoft\Windows\PLA\foo

and

  • HKLM\SOFTWARE\Microsoft\Windows NT\CurrentVersion\
    Schedule\TaskCache\
    Plain\{F95FD9E0-54DB-464C-B379-FF720B10726A}


  • HKLM\SOFTWARE\Microsoft\Windows NT\
    CurrentVersion\Schedule\TaskCache\
    Tasks\{F95FD9E0-54DB-464C-B379-FF720B10726A}

It survives the reboot, but the trace needs to be restarted.

Logman, the Windows volverine

Update

Coincidentally, @HECFBlog @nicoleibrahim released a tool ETL Parser that helps to at last extract raw buffers and as a result it produces a CSV file with data that can be analyzed row by row. This is the closest so far that I have seen for a tool to be able to help analyze the output of api trace log. Have a look at the screenshot:

Old Post

Almost everyone is excited about .etl files that are produced as a result of Event Tracing for Windows.

Almost, because not me.

This feature is so rich in … features. Except it’s only for MS internal consumption. At least, it seems to be the case in some very really interesting… well… cases…

It all started when I looked at the logman tool command line arguments; one that immediately caught my attention was this one:

logman create api

Aha… A basic API Monitor!

But not only that. It allows to run API Monitoring across different systems!!!

Oh… this could be a nice covert channel to transfer data between systems. Write one piece that constantly calls a monitored API and feeds it with the data to transfer, and then – on the other end – collect this data on the other system using logman tool. You could definitely implement it in a duplex set-up too.

Simple.

So I thought.

First, I immediately tested the ‘create api’ bit it and it worked like a charm:

logman create api foo -f bincirc -exe c:\windows\notepad.exe -o c:\test\notepad.etl

logman start foo

Now you have to simply run Notepad.exe (c:\windows\notepad.exe) and the .etl log will be created&updated as long as notepad.exe runs; the example content of the binary .etl file is as follows:

You can clearly see the APIs being recorded when Notepad is running:

  • RegisterClassW with the Unicode class ‘OleMainThreadWndClass’
  • GetAppCompatFlags2
  • IsProcessDPIAware
  • GdiReleaseDC
  • etc.

The only problem remaining:
– how to convert this binary blob into something more readable?

After googling around, I discovered that the tool basically embraces the api tracng functionality offered by the IApiTracingDataCollector interface. When you read into the docs of this interface you will soon realize that logman’s command line argument ‘-f’ that is supposed to determine the file type for the output file can be only… binary. So any attempts to specify TSV, or CSV will fail 🙁

Okay.

Since I couldn’t bite it from this end, I started looking at Windows Performance Analyzer (WPA) and other tracing and trace conversion tools.

No matter which one I used, I could only get a basic flow of the events, but w/o these interesting gore details of each API call:

It’s all nice and eye candy, but the problem is already visible:
– if you don’t know how to parse, you simply don’t.

As a last resort I tried ‘tracerpt’:

tracerpt <log> -o <output> -of CSV

.. and it provided a similar enigmatic output:

Some more googling around and now I know I need to get a .PDB file for the api trace provider, or some other schema files that will allow WPA to parse it properly…

Sigh…

The provider’s GUID is 7535aef9-4a3b-482b-91eb-25db0299995d.

It is nowhere to be found.

Eventually I gave up & I asked on Twitter.

Unfortunately, Alex Ionescu, and Zac Brown are both pessimistic 🙁 Still, I am grateful to them for chipping in and providing the useful feedback – if they can’t do it, I guess we explored all the ‘normal’ possibilities.

But then I am thinking… so… if it is an internal schema, then there is only one way out.

Brute-Force attack.

I may cover it in the next post.

From the blue team’s perspective, if you want to detect logman’s activity, in particular api tracing, you may be interested in this process tree:

The example command line arguments from my VM test run are as follows:

  • C:\Windows\system32\svchost.exe -k netsvcs
    • taskeng.exe {A7B77AA7-00E9-45C4-92C5-31C3868DB30D} S-1-5-18:NT AUTHORITY\System:Service:
      • C:\Windows\system32\rundll32.exe C:\Windows\system32\pla.dll,PlaHost “foo” “0x934_0x91c_0x2a045dff88a”

One thing is also worth mentioning – many logman command line option talk about running some task when some event happens; at first I thought it may be a new persistence mechanism, until I realized the tasks names required by these commands are task names registered using a Task Scheduler. So… yet another fail on the documentation, as it is very cryptic and talks about these various traces in a very superficial way 🙁