Bitmap hunting in SPL, Part 2

In my previous post I introduced the concept of bitmap hunting. Today I will show another example that helps to find a sequence of more than 2 events.

Consider this artificially generated sequence of events:

| makeresults           | eval _time=_time + 01 | eval evt="Run" | eval program="outlook.exe"
| append [| makeresults | eval _time=_time + 02 | eval evt="Run" | eval program="firefox.exe"]
| append [| makeresults | eval _time=_time + 03 | eval evt="Run" | eval program="firefox.exe"]
| append [| makeresults | eval _time=_time + 04 | eval evt="File" | eval file="...\invoice.lnk" ]
| append [| makeresults | eval _time=_time + 05 | eval evt="Run" | eval program="cscript.exe"]
| append [| makeresults | eval _time=_time + 06 | eval evt="Run" | eval program="powershell.exe"]
| append [| makeresults | eval _time=_time + 07 | eval evt="Run" | eval program="mshta.exe"]
| append [| makeresults | eval _time=_time + 08 | eval evt="File" | eval file="...\bar.tmp" ]
| append [| makeresults | eval _time=_time + 09 | eval evt="Run" | eval program="svchost.exe"]
| append [| makeresults | eval _time=_time + 10 | eval evt="Run" | eval program="outlook.exe"]
| append [| makeresults | eval _time=_time + 11 | eval evt="Run" | eval program="dllhost.exe"]
| append [| makeresults | eval _time=_time + 12 | eval evt="File" | eval file="...\foo.tmp" ]
| append [| makeresults | eval _time=_time + 13 | eval evt="Run" | eval program="cscript.exe"]
| append [| makeresults | eval _time=_time + 14 | eval evt="Run" | eval program="powershell.exe"]
| append [| makeresults | eval _time=_time + 15 | eval evt="Run" | eval program="mshta.exe"]

giving us this data:

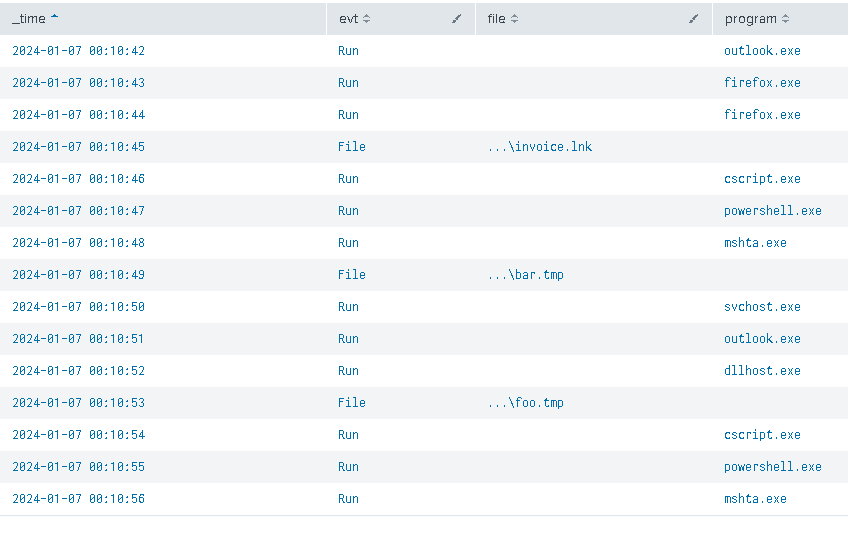
It’s completely fictional, but you can see that we have two clusters of cscript, powershell, mshta program executions, with one following the file creation event where the file was a shortcut file using the file extension LNK (often used by malware).

Let’s say we want to find all the clusters of these 3 programs being executed AFTER any LNK file was created, and ignore the others.

We can first create a bitmap by adding the following code:

| eval b=
   case (
         evt="Run" and program="cscript.exe", "c",
         evt="Run" and program="powershell.exe", "p",
         evt="Run" and program="mshta.exe", "m",
         evt="File" and like (file, "%.lnk"), "l",
         1=1," "
        ) 
| eventstats list(b) as allb
| eval allb_bitmap = mvjoin(allb,"")
| table _time, allb_bitmap, b, evt, file, program

giving us this:

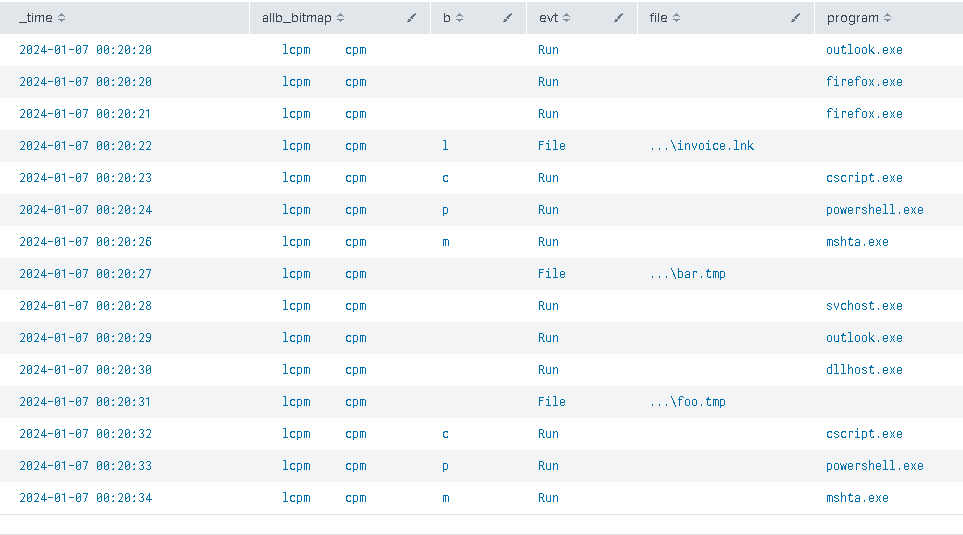
We can clearly see 2 interesting clusters, but only one fitting our criteria.

We can obviously exclude the rows where the b is empty, but we still need to split these lcpm and cpm clusters into separate buckets.

And the bucket is the word!

Modifying our earlier code a bit:

| eval b=
   case (
         evt="Run" and program="cscript.exe", "c",
         evt="Run" and program="powershell.exe", "p",
         evt="Run" and program="mshta.exe", "m",
         evt="File" and like (file, "%.lnk"), "l",
         1=1," "
        ) 
| bucket _time span=10s
| eventstats list(b) as allb by _time
| eval allb_bitmap = mvjoin(allb,"")
| where b!=" " and like(allb_bitmap, "%lcpm%")
| table _time, allb_bitmap, evt, file, program

we get this:

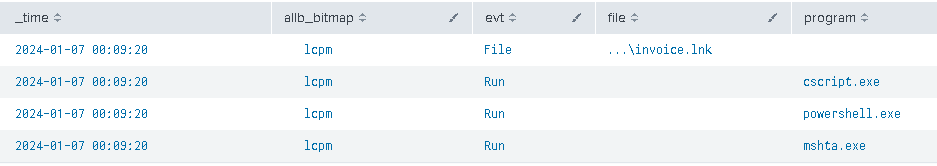
We can now start the triage!

Of course, there is a manual effort to this exercise and it may not be always possible to fully automate it, but I hope you can see the potential of this technique.

And see how cheap that is! There are no summary indexes, nested queries, complex statistics involved – it’s just a simple exercise of putting interesting events on a one-dimensional map, and then breaking them down into manageable clusters.

Bitmap Hunting in SPL

One of the most annoying hunting exercises is detecting a sequence of failures followed by a success. Brute-force attacks, dictionary attacks, and finally password spray attacks have all this in common: lots of failures, sometimes followed by a success.

The problem is stated clearly, but there is no easy solution.

Why?

Most of logs are stateless. Every log row describes an event, and every row is detached from the others. Combing them, combining them, clustering them and extracting some juice from them is a detection engineering art on its own…

So, yes… it’s actually hard to detect these types of sequences and it’s usually very expensive f.ex. if you use Splunk it offers its transaction command for situations like this, but it’s a very very bad choice: it affects performance too much.

There is a more elegant solution out there though… and I call it bitmap hunting.

Instead of getting fixated on the sequence of the events that fit our narrative (set of failures followed by a success in the above example), we focus on building a bitmap of ALL states registered by the respective telemetry, the one that we can always group by the endpoint name, user, time/time bucket, etc..

Let’s look at an example:

| makeresults | eval endpoint="sys01" | eval username="test" | eval status = 0  
| append [| makeresults | eval endpoint="sys01" | eval username="foo" | eval status = 0] 
| append [| makeresults | eval endpoint="sys01" | eval username="bar" | eval status = 0] 
| append [| makeresults | eval endpoint="sys01" | eval username="abc" | eval status = 0] 
| append [| makeresults | eval endpoint="sys01" | eval username="nimda" | eval status = 0] 
| append [| makeresults | eval endpoint="sys01" | eval username="root" | eval status = 0] 
| append [| makeresults | eval endpoint="sys01" | eval username="r00t" | eval status = 0] 
| append [| makeresults | eval endpoint="sys01" | eval username="john.doe" | eval status = 1]
| append [| makeresults | eval endpoint="sys02" | eval username="jane.doe" | eval status = 0] 
| append [| makeresults | eval endpoint="sys02" | eval username="jane.doe" | eval status = 1]
| table _time, endpoint, username, status

These SPL commands build a list of fake events for us, where 2 endpoints sys01 and sys02 register their logon events, where the endpoint, username, and status fields/columns include all the info about the set of events occurring. In essence, this is how it looks like (ignore the _time as I didn’t want to clutter the commands above even more):

We can use the status of all events (success=1, failure=0) to build a bitmap of all of them by grouping them all together by the endpoint:

| stats list(status) as allstatuses, list(username) as allusernames by endpoint
| eval allstatuses_bitmap = mvjoin(allstatuses,"")
| table endpoint, allstatuses_bitmap, allusernames

The result gives us this:

As you can clearly see, it’s pretty easy now to ‘guess’ that sys02 user Jane.doe is just a possible typo or otherwise minor issue that led the user account to be logged in after the first failure, while the sys01 system experienced a barrage of logon attempts with different user names that eventually led to a successful logon. The sys01 should be definitely investigated.

Looking at the bitmap created by all the logon statuses we can quickly devise a logic to detect f.ex. successful password spray/brute force/dictionary attacks:

| stats list(status) as allstatuses, list(username) as allusernames by endpoint
| eval allstatuses_bitmap = mvjoin(allstatuses,"")
| where like(allstatuses_bitmap, "%0001")
| table endpoint, allstatuses_bitmap, allusernames

In the example above, we detect at least 3 failed logons before a successful logon.

And yes, it will hit False Positives too (legitimate logons will be amongst the malicious ones), but number of failed logons will be usually high enough and as such, a good indicator of badness, plus at least we now have something to triage…

p.s. logon events are just one example, but you can convert any condition into a bitmap — as such, you can build more complex conditions too (f.ex. more than two specific events present in a sequence of events)