The function #61 exported by the shell32.dll uses an internal name RunFileDlg.
So, there is no surprise that running:
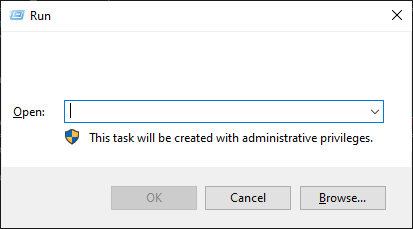
rundll32.exe shell32.dll, #61
presents us the familiar Run Dialog Box:
The function #61 exported by the shell32.dll uses an internal name RunFileDlg.
So, there is no surprise that running:
rundll32.exe shell32.dll, #61
presents us the familiar Run Dialog Box:
We love to put a wedge between the detection and response. Many of us kinda agree that telemetry analysis is one thing and the actual forensic examination of the evidence is another.
However…
In this post I will try to turn the tables a bit.
Prefetch files
All the command line tricks you use to execute your executable, script, load your library, etc. will end up with Prefetch entries created on the victim system.
Look at clusters of Prefetch files created within small time intervals and you will find interesting sets of prefetch file clusters related to a bundle of programs executed one after another – to pivot from.
Most Recently Used
This Magnet Forensics article describes a number of forensic artifacts related to Most Recently Used files/commands and RecentDocs that we can track with telemetry.
By careful examination of these, we can detect a lot of user-driven activity that can give us hints about what is happening on a system as a result of user activities, and ignore all the telemetry noise coming from OS and legitimate software activity.
Jump List App ID analysis
Again, instead of concentrating on the input (obfuscated command lines leading to execution of many lolbins, executables, often nested), we focus on analysis of files with the following extensions:
automaticDestinations-ms.customDestinations-msWe can use exclusions like this list. We can also use techniques like Least Frequency Occurrence (LFO) to focus on outliers. We can pivot from them and see what happens on the investigated system prior to these artifacts being created.
Application crashes
Telemetry can tell us about a lot of interesting events. One of them is an application crash.
Anytime we see an invocation of werfault.exe, or creation of a .dmp file, we should look at the events preceding this event.
Persistence
I wrote a lot about this topic and it still stands true. Collect telemetry related to these generic load points and you will find some ‘bad’ in no time.
Quarantine files
My old tool DeXRAY is still being used in 2025. I am quite shocked, but also pleased. What it means in practice though is that:
Lnk files
Surprisingly, they are not created that often, so they are an interesting artifact to look at.
They may point to an insider threat, they may point to a malware, or make us waste some triage time leading us to nowhere (list of exclusions should be easy to build though: ‘What's New.lnk', ‘About <program>.lnk‘, ‘Uninstall <program>.lnk‘, ‘Magnify.lnk‘, ‘Narrator.lnk‘, etc.).
Background Activity Moderator (BAM)
This is an obvious candidate for monitoring as it references the user’s SID and can tell us who actually executed that particular program.
Monitoring the entries in this Registry branch can help us to detect anomalies when we start seeing execution of unusual processes.
Unusual File Creation activity
In many posts in the past I have highlighted a lot of DLL side-loading techniques that are quite unusual f.ex.:
Detecting file operations associated with these unusual side-loading activities is a good way to detect more advanced attackers (and yes, many of them are actively using some of my techniques!).
There are probably more forensic artifacts that we can monitor for some early detections, but the set above should give you some pointers…